Monday, May 23, 2011

May Month Awakening?

What do you know of a typical month of May?  It is normally very active in the weather category with numerous tornado reports and even more wind and hail reports, but this May has been rather boring.
That is until last weekend.  Here are the storm reports for Saturday:
Map of 110521_rpts's severe weather reports
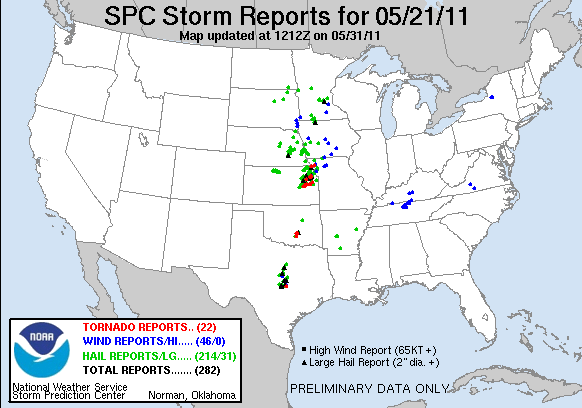
And the storm reports for Sunday: Map of yesterday's severe weather reports
Looks like May is trying pick up the pace to hold on to what it is historically known for.  Sunday's events is already holding a record for itself.  Not in the number of tornadoes or number of storm reports, but because of a tornado that struck a city with a population of over 50,000 called Joplin, MO.  It took a direct hit with a very intense, unrated tornado that has so far killed 89 people as of the morning of May 23, 2011 making it the 21st deadliest tornado in recorded history.  To get a better idea of the damage, go to http://www.buzzfeed.com/mjs538/devastating-pictures-of-the-joplin-missouri-torna.

With what happened yesterday should we expect something similar for today?  As it is nearly impossible to predict an exact perfect setup as was seen yesterday, we can definitely predict whether things will be simliar.  Unfortunately, things are looking like they will be similiar to yesterday, just in different areas.  Here is SPC's convective outlook for today:
The moderate risk over Oklahoma, SE Kansas, and SW Missouri holds the highest risk for tornadoes (10%) and hail (45%).  This area also holds the highest percentage of significant hail.  The other area of moderate risk holds a risk of hail as well (30%), with the possibility of it being significant, and a high chance of strong, damaging winds (45%).  Keeping that in mind and looking at the NAM and GFS models, here is my forecast for severe weathering using the SVRPROB:
I have highlighted similar areas as SPC did, but I have noticed some important factors in severe weather in lighter shade of red areas that I will watch for because of multiple layers of lifting and very high CAPE values.  Where I found areas of the most instability is where I have the high risk areas.  These areas are located in an environment of high CAPE, little CIN, lifting in upper, mid, and low levels of the atmosphere, abundant moisture, and areas where the surface winds are nearly perpendicular to the winds in the mid-layers of the atmosphere.  All of this pretty much brews up perfect conditions for long-lived tornadoes and large hail as long as no other factors prevent it from happening.  Storms have already formed and dropped lots of rain over NE Oklahoma, extreme NW Arkansas, and SW Missouri which will prevent further severe development for the time being, but the areas I have highlighted in a high risk have not seen anything yet and still getting peaks of sunshine, which will only exacerbate the situation.  The darker shades of red is where storms will likely develop overnite.

Overall, keep a sharp eye on the highlighted areas, esp. the ones in a high risk area in the SVRPROB and ones in the moderate risk by SPC.  Stay safe and be alert.

Saturday, May 21, 2011

Great Mississippi Floods: Which is Worse?

Within one century, between 1912 to 2011, there has been 3 major floods of the Mississippi River: The Great Mississippi Flood of 1927, The Great Flood of 1993, and The 2011 Mississippi River Flood.  All of these major flood events have been devastating, but which one is actually worse?

The Great Mississippi Flood of 1927 held the record for the most destructive river flood in the history of the United States.  It filled the tributaries in Kansas and Iowa to the max capacity and caused the Cumberland River in Tennessee to top its levees to a record height of 56.2 feet.  The flooding was so bad the it broke the levee at Mounds Landing causing a chain reaction of multiple levees breaking.  By the time all was said and done, 145 levees were broke and 27,000 square miles flooded.  The flooded areas had water sitting 50 miles wide, 100 miles long, and was as deep as 30 feet in some areas.  Over $400 million in damages and a death toll of 246.  Later in 1927, the width of the Mississippi River reached an amazing 60 miles south of Memphis, TN.  This flood help create a very important factor of preventing it to happen again and that was the erection of the Morganza Spillway.


Now going to 1993 when another major flood occured in the Mississippi River and the Missouri River.  Some say this flood exceeds the 1927 flood, but it depends on which particular area of the flood you are talking about.  The damage of the 1993 flood is $15 billion with a death toll of 50.  The flooded area covered an area as big as 30,000 square miles.  The Mississippi River flooded for almost 200 days.  About 100,000 homes were destroyed, 15 million acres were overwhelmed with water, and 2 towns, Valmeyer, Illinois and Rhineland, Missouri were completely relocated to another location of higher ground.  Here is an image of part of the Mississippi River, Missouri River, and Illinois River when it is normal (top) and when it was flooded in 1993 (bottom). 


Finally, we come to the 2011 Mississippi River Flood which is looking to be even more devastating than the other two.  This flood is still going on, but the information that we know of right now is pretty incredible.  This flood is being called a 500-year flood for the Mississippi River.  Because of the fact that it is ongoing, a summary can't really be made for it yet.  One fact that can be stated is the damages which are estimated to range between $2-4 billion.  The damages right now show that this flood is not as bad as the Great Flood of 1993, but this flood isn't over with yet.  Thousands of homes have already been submerged with water stretching from Missouri and Illinois to Louisiana.  The image below is sediments from the Mississippi River flowing into Lake Pontchartrain.
 

So now we go back to the original question, which flood was worse?  In damages, right now it would be the Great Flood of 1993 given today's dollar value.  The Great Mississippi Flood of 1927 would round up to be about $4.9 billion and the Great Flood of 1993 would round up to about $7.6 billion for today's dollar value.  In death tolls, it would be The Great Mississippi Flood of 1927 with 246 deaths.  In flooded coverage, that's hard to tell because it could be the Great Flood of 1993 or the 2011 Mississippi River Flood since the flood that is going on right now isn't done and still getting rain to add on to it.

What are the differences?  Two main words, knowledge and technology.  As mentioned earlier, the Morganza Spillway was developed after the Great Mississippi Flood of 1927 to prevent a flooding of the Mississippi River to be 80 miles wide.  It has only be opened twice, once in 1973 and right now in 2011, which is why the Mississippi River is maintaining an appoximate width of 3 miles wide.

Wednesday, May 11, 2011

Wild Wicked Wednesday

It has been a while since there has been a tornado event in the U.S.  Well two weeks to be more approximate, but things have been fairly quiet in that time period, other than the flooding of the Mississippi River and other rivers connected to it, until now.  If you remember, in April, most of the tornadoes were in the well known Dixie Alley, another part of the true Tornado Alley area.  That's very typical for the month of April, but now it is May and things have flip-flopped.

Yes, those are literally lightning flip flops.  We will start to see an increase in tornadic activity in the Great Plains now than in the Southeast like in April.  So what kind of weather should we look forward to today and how bad is it going to get?  Here is my forecast from 18Z (1:00 PM CDT) to 06Z (1:00 AM CDT).
The red areas indicate areas of moderate risks of tornadoes, damaging winds, and hail.  The reason so is because these areas have the most instability and lifting out of all with a significant amount of moisture.  The outlined black oval in eastern Oklahoma could potentially have a higher risk of severe weather and a likely area of significant severe weather.  Reason being is where the higher CAPE and lowest CIN line up along with other important variables.  The moderate risk areas already have severe thunderstorm watch areas in them.  The area of potential increased risk would be a likely area of a future tornado watch.
Now at this time things start to look more interesting.  Now I have issued some areas of high risk because upper-level lifting, mid-level lifting, low-level lifting, abundant moisture inflow, decent CAPE, low CIN, and warm air advection all stack on top of each other in the high risk areas giving a nearly perfect environment for severe weather and even significant severe weather.  The area between the two high risks I highlighted as a potentially increased risk because it does have a little higher CIN in that area which would inhibit some lifting, but if the lifting mechanizisms remain strong enough they will likely push through the low-level stability and create supercells.  Tornado watch boxes are expected in the high risk areas with the chance of them becoming a PDS (Particularly Dangerous Situation).
Things really start to cook in the Great Plains as the air becomes even more unstable around this time.  A larger span of high risk areas than before an still seeing the potential for and increased risk due to higher CIN values, but like I said before if the lifting mechanizisms are strong enough they will push through the low-level instability.  Expect a much larger area of tornado watches throughout this time period with some of those possibly being a PDS because of how well things line up for impressive supercell development to occur and create some significant weather.
Later in the evening and deeper into the night things start to calm down some.  No high risks now, but still keeping a good sized area of moderate risk and an area of potential increased risk.  Tornado watches are still highly likely in the area of possible increased risk, but the activity should be gradually dissipating and weakening.
Finally, in the very early hours there is a much smaller moderate risk area to watch out for as the air cools off from nighttime cooling and evaporation from the rain that will be falling throughout the day.

The state with the highest risk of severe weather and even significant severe weather would be Central and Eastern Oklahoma with other areas like Eastern and Northeaster Texas and Central Kansas will be other areas to focus in on too throughout the day.  Keep your eyes peeled if you are in or around these areas or know people in these areas.  Storm chasers be careful and stay alert.


Thursday, May 5, 2011

Breath Easy, Woosah!

That's right.  Woosah!  Take a deep breath and breathe out, but don't everyone in the Southeast do it all at once or else this might happen.


Just kidding.  The Southeast should be sighing relief right now and for a while because the month of May is looking to be very calm compared to April.  After looking at various models for weeks ahead things, in general, look to be clear of significant severe weather.  Not to say there won't be rain anytime, but tornadoes are most likely out of the question.  This is fantastic news for all of the people who have been affected by the recent and historical tornado event last week because the next biggest chance of rain isn't until next week on Friday.  Clouds will come and go throughout this weekend and through next week, but rain looks like it's going to be shy for now.  Enjoy it because we really need this opportunity to try to finish cleaning up and help get people's lives back together.

On the topic of the tornado relief, all I have to say is wow.  I have been listening to the radio and hearing the miracles that have been coming every day to the areas needing the most support.  It never seizes to amaze me how we all unite as one and help each other in our times of need.  This is what America is truly about.  This is why we are the United States of America because we, the states, will "unite" in each states time of need.

God bless everyone and God speed.

Sunday, May 1, 2011

METAR Mike's Blog: Unfortgettable Month, Unforgettable Ending

METAR Mike's Blog: Unfortgettable Month, Unforgettable Ending: "April has now finally ended. Sadly, it ended with the biggest bang yet that has ever been seen in over 65 years. What caused such a dramat..."

Unfortgettable Month, Unforgettable Ending

April has now finally ended.  Sadly, it ended with the biggest bang yet that has ever been seen in over 65 years.  What caused such a dramatic ending?  To put it simple, everything just lined up perfectly to create an event that created the April 25-28 Super Tornado Outbreak.  Normally, I post images and even some videos, but this time it is strictly going to be words and statistics.  Here are a few statistics published by NOAA on the event:
  • NOAA estimates 312 tornadoes during April 26-28.  They estimate that 266 of those are all from 8AM on the 27th to 8AM on the 28th.
  • NOAA estimates of at least 344 deaths from April 26-28.  They estimate that 334 of those are from 8AM on the 27th to 8AM on the 28th.
Pretty incredible huh?!

Here are some more up-to-date statistics about the tornadoes.
  • As of right now, there has been 130 confirmed tornadoes.  Sadly and unfortunately about 112 tornadoes have not been confirmed yet, which brings the estimated total to 242 tornadoes so far.
  • Currently, out of the confirmed tornadoes, there are 26 EF0, 50 EF1, 24 EF2, 16 EF3, 13 EF4, and 2 EF5.  Some of this are not official as continuing investigation goes on to either verify the standing rating or to increase the rating.
  • There were about 21 states and one Canadian Province effected by the tornadoes.  The states are:  Tennessee, Texas, Oklahoma, Arkansas, Michigan, Indiana, Mississippi, New York, Louisiana, Kentucky, Ohio, Alabama, Missouri, Virginia, West Virginia, Georgia, Maryland, Pennsylvania, South Carolina, North Carolina, and Florida.  The one Canadian Province was Ontario.
  • About 17 of those were long-track tornadoes, that is tornadoes with a distance of 25 miles or greater.  This distance by no means anything official, it's just my judgement and approximation.  Severeal tornadoes have not been measured in their path length so that number is likely to change.
  • The longest tornado track so far is one that originated in Raleigh, MS and ended north of Pennington, AL.  The track length is 92.3 miles.  The runner up the tornado that tract thru Tuscaloosa and Birmingham with a track length of at least 80 miles.  That tornado could be longer than that as it continues to be surveyed.
  • The deadliest tornado is the Tuscaloosa/Birmingham tornado with 65+ fatalities and 1000+ injuries.
  • The cost of damages is estimated to be between $2-5 billion.
Absolutely amazing information isn't it.  This information is most likely to change as it will take weeks and maybe even months to really get close to the exact count on the number of tornadoes, deaths, and the cost of damages.  As time goes on, I will inform you all the final statistics from the event.  Keep your thoughts and your prayers to all of the people and families the have been effected by this tragic event.  Also, If you have time and/or near the areas impacted please help out in anyways possible whether its buying someone lunch or bring a truck load of people with tools and helping to clean up the disaster.  Anything like that will help these lives get closer to normality.